
A practical guide for leaders who need to know if a new Asian market is working—months before revenue proves it
Six months into your Asia launch.
Revenue: almost nothing.
The board asks: “Is this working?”
Your regional manager says: “We’re building relationships.”
Both of you are guessing.
That is the problem leading indicators for new market sales solve. They are early, measurable signals that show whether a market is moving toward revenue before deals close. In plain terms: they replace “trust me” with numbers you can review every week.
Good leading indicators show:
- whether you are reaching the right buyers;
- whether those buyers respond;
- whether conversations turn into meetings;
- whether you are engaging several people per account;
- whether deals move from one stage to the next.
Most leadership teams ask:
“When will Asia generate revenue?”
But for B2B companies entering a new Asian market, the better question is:
“What would we expect to see this month if this market is on track?”
Because revenue is the last thing to arrive in a new market.
A market with no revenue can be on track.
A market with one lucky deal can be stuck.
This guide builds on our pillar, Breaking Into Asia: 5 Critical Asia Expansion Mistakes, and turns the “patience with progress” idea from our guide to relationship selling in Asia into a dashboard.
- TL;DR — Key Takeaways (our view)
- Revenue is a lagging indicator. It arrives late in a new market.
- Track six leading indicators weekly: reach, response, meetings, stakeholders, next steps, stage conversion.
- Add learning indicators: objections logged and messages tested.
- Set your own baseline per market. Do not borrow generic benchmarks.
- Report the same way every week. Trends matter more than single numbers.
- Patience needs progress. If indicators stall, change something.
If you only do one thing: agree with leadership, before launch, which three indicators will define “on track” for each market.
Who This Guide Is For—and Who It Is Not For
This Guide Is For
- CEOs and boards reviewing a new Asian market;
- CROs and sales leaders reporting Asia progress to headquarters;
- regional managers who need to show progress before deals close;
- SDR managers (SDR: sales development representative, who runs first outreach and books meetings);
- companies working with an outbound partner in Asia;
- teams entering several Asian markets at once.
This guide is especially useful if your team is asking:
- How do we know Asia is working?
- What should we report weekly?
- What counts as good progress?
- When should we change course?
This Guide Is Not For
- you need post-sale metrics such as retention or expansion (read Customer Success KPIs Every B2B Team Should Track When Expanding in Asia);
- you already have steady revenue in the market;
- you want universal reply-rate benchmarks;
- you sell only through distributors you do not manage.
Practical fit check: if your Asia report has a revenue line and nothing else, this guide is for you.
What Leading Indicators for New Market Sales Mean
Leading indicators for new market sales are early, measurable signals that show whether a new market is moving toward revenue before deals close. Examples include accounts reached, reply rates, meetings held, stakeholders engaged per account, next steps agreed, and conversion between pipeline stages.
Leading vs. Lagging Indicators
| Type | Examples | When It Shows | What It Tells You |
|---|---|---|---|
| Leading | Replies, meetings, stakeholders, next steps | Weeks | Whether the engine is working |
| Learning | Objections, messages tested, segments tried | Weeks | Whether you are getting smarter |
| Lagging | Revenue, closed deals, contract value | Months | Whether it worked |
Practical Rule (our take)
Lagging indicators tell you what happened.
Leading indicators tell you what to change.
Why Leading Indicators Matter in a New Asian Market
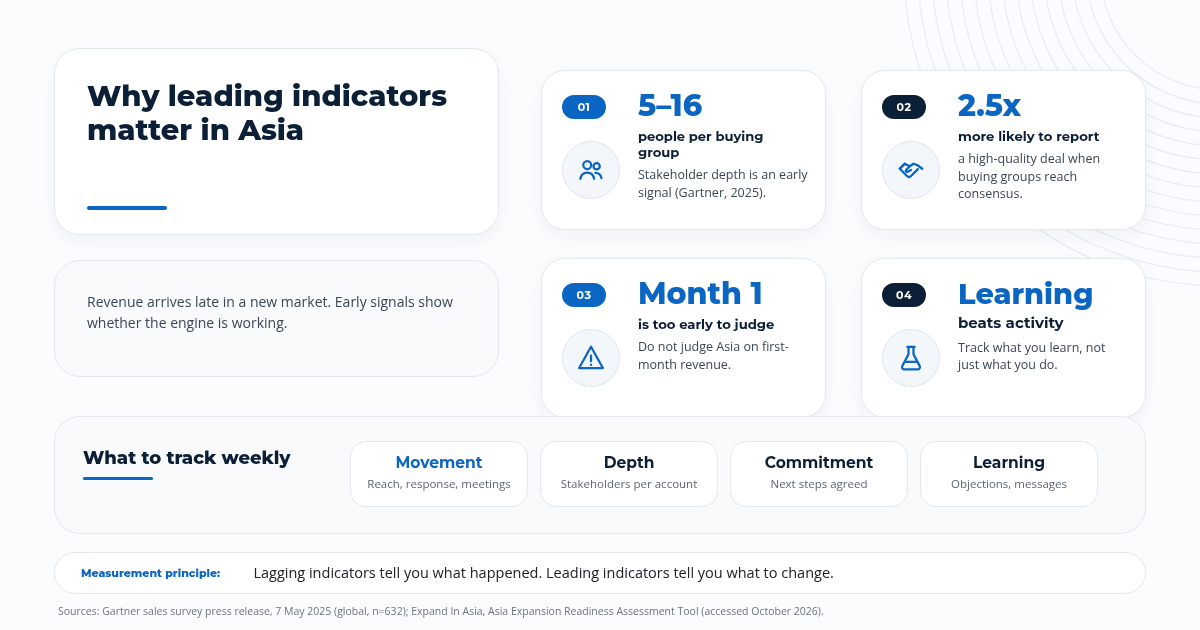
Reason 1 — Asian B2B Cycles Often Take Longer
In our experience, trust and relationships take time in many Asian markets, and decisions often involve several levels of the organization. Revenue can lag well behind real progress.
Reason 2 — Buying Groups Are Large
Gartner’s May 2025 global survey of 632 B2B buyers found buying groups of five to 16 people across up to four functions, and found that groups that reach consensus are 2.5 times more likely to report a high-quality deal.1 In plain terms: how many people you engage per account is a meaningful early signal.
Reason 3 — Leadership Patience Runs Out Without Evidence
Expand In Asia’s Asia Expansion Readiness Assessment Tool asks whether leadership will avoid judging Asia only by first-month revenue.2 In our experience, many new markets are stopped too early because nobody agreed what progress should look like.
Reason 4 — Activity Is Not Learning
The same tool notes that a new SDR team without close management usually creates activity faster than learning.2 Leading indicators should show both: are we busy, and are we getting smarter?
Practical Rule (our take)
Patience is easier to give when progress is visible.
The Asia Progress Dashboard
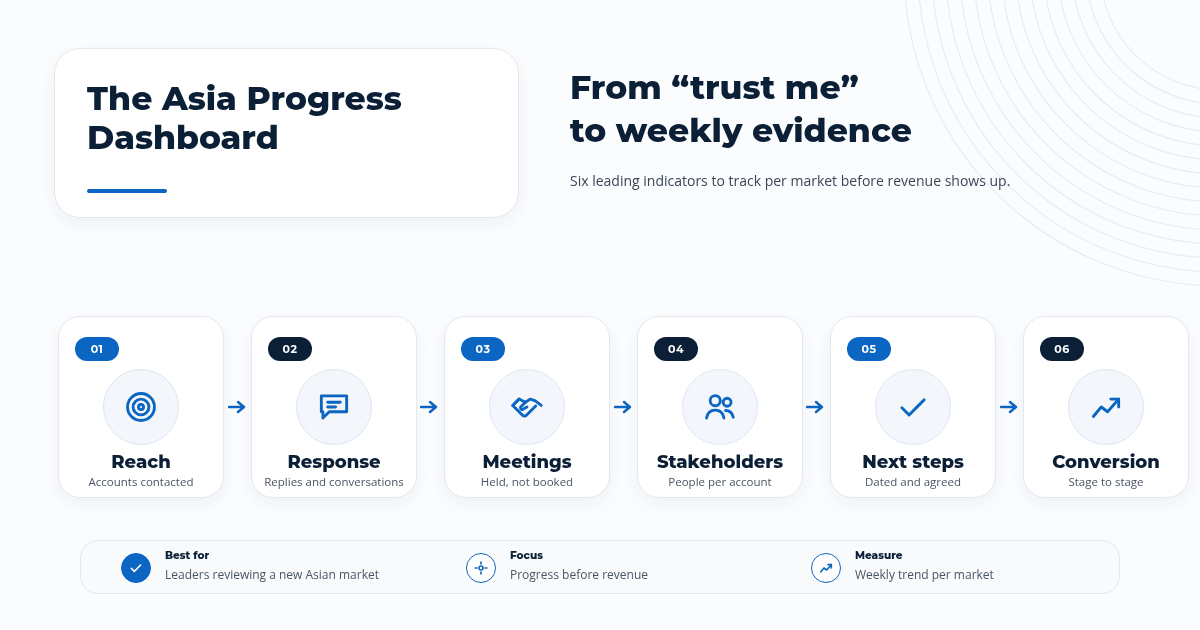
Our framework, the Asia Progress Dashboard, tracks six leading indicators in order. Each one depends on the one before it.
Indicator 1 — Reach
What It Measures
How many target accounts and contacts you have attempted to reach this week, by market and segment.
Why It Matters
Too little reach and nothing else can move.
Indicator 2 — Response
What It Measures
The share of contacted people who reply, accept a connection, or have a real conversation by phone.
How to Read It (Our View)
Low response usually points to the wrong list, the wrong message, or the wrong channel. See How to Reach B2B Decision-Makers in Asia Who Aren’t on LinkedIn.
Indicator 3 — Meetings Held
What It Measures
First meetings that actually took place with your target buyer profile.
Why “Held,” Not “Booked”
Booked meetings that do not happen are not progress.
Indicator 4 — Stakeholders Engaged per Account
What It Measures
How many people you are in contact with inside each active account, and at which levels. This is sometimes called multi-threading depth.
Why It Matters
In our experience, single-contact accounts stall more often, especially in hierarchical organizations.
Indicator 5 — Next Steps Agreed
What It Measures
The share of meetings that end with a concrete, dated next step.
Link to Relationship Progress
This connects to the four progress signals from our masterclass: contacts sharing priorities, introducing stakeholders, explaining decisions, and agreeing next steps.3
Indicator 6 — Stage Conversion
What It Measures
The share of opportunities moving from one pipeline stage to the next, for example from first meeting to second meeting, or from second meeting to proposal.
Why It Matters
It shows where deals get stuck.
Practical Rule (our take)
Fix the first indicator that is weak.
Everything after it depends on it.
Learning Indicators: Are You Getting Smarter?
Leading indicators show movement. Learning indicators show insight.
| Learning Indicator | What It Measures | Why It Matters |
|---|---|---|
| Objections logged | New and repeated objections per market | Shows what to fix in message or offer |
| Messages tested | Variations tried and results | Shows what resonates locally |
| Segments tested | Industries or company sizes tried | Shows where demand concentrates |
| Buyer quotes captured | Problems described in buyers’ words | Strengthens proof and positioning |
Relatable Example
“Twelve meetings, three asking for local references” is a learning. It tells you to win one local reference customer before scaling outreach.
How to Set Baselines (Without Fake Benchmarks)
We do not recommend copying generic reply-rate or meeting-rate benchmarks for Asia. In our experience, they vary too much by country, industry, channel, and offer to be useful.
Our Recommended Approach
- Run outreach for your first few weeks in a market.
- Record each indicator weekly.
- Use that period as your baseline.
- Set improvement goals against your own baseline.
- Compare markets by trend, not by absolute numbers.
Relatable Example
If Vietnam’s response rate is lower than Singapore’s but rising each week after you switched to Vietnamese-language outreach, Vietnam may be the healthier trend.
Leading Indicators by Channel
Different channels show progress in different ways. Track response per channel so you know which one is working in each market.
| Channel | Response Signal | Watch For |
|---|---|---|
| Connection accepts and replies | Accepts without conversations | |
| Replies, not opens | Opens are an unreliable signal | |
| Phone | Real conversations with the target role | Many calls reaching gatekeepers only |
| Events and referrals | Introductions that turn into meetings | Contacts collected but never followed up |
Our View
Channel mix differs by market. Use the dashboard to decide where to put effort, not to prove one channel is always best. For a channel comparison, see Cold Email vs LinkedIn Outreach: Which Converts Better in Asia?.
Before launch, you can also check whether your team is ready to measure this with the Asia expansion readiness assessment, and test early demand with our guide to how to validate product-market fit in Asia.
How to Report Asia Progress to Headquarters
Weekly Update (Our Template)
| Market | Reach | Response | Meetings Held | Avg. Stakeholders per Active Account | Next Steps Agreed | Key Learning |
|---|---|---|---|---|---|---|
| Market A | — | — | — | — | — | — |
| Market B | — | — | — | — | — | — |
Monthly Review Adds
- stage conversion by market;
- top objections and how you will respond;
- messages and segments to stop or scale;
- one decision for next month.
Our View
Keep the format the same every time. Leaders read trends, not one-off numbers.
For pipeline basics, read Building a B2B Sales Pipeline from Zero in a New Asian Market.
What “On Track” Can Look Like Over Time (Illustrative)
These phases are illustrative, not fixed timelines. Every market and sales cycle differs.
| Phase | What You Should See | What to Worry About |
|---|---|---|
| Early weeks | Reach and response baselines; first meetings | No responses at all from the target segment |
| First months | Meetings held, objections logged, stakeholders growing | Many meetings, no next steps |
| Later months | Second meetings, more stakeholders, stage movement | Accounts stuck at one contact |
| Beyond | Proposals, pilots, first deals | Stage conversion flat for months |
Practical Rule (our take)
Patience matters, but it should come with progress.
Need Help Building Pipeline You Can Measure?
Expand In Asia helps B2B companies create and track early pipeline across Asian markets through:
- market prioritization;
- ICP definition (ICP: your ideal customer profile);
- localized buyer messaging;
- LinkedIn, email, and phone outreach;
- SDR execution and management;
- appointment setting with decision-makers;
- weekly reporting on leading indicators;
- objection and feedback logs by market.
Talk to Expand In Asia about measuring new market progress →
How to Diagnose a Stalled Indicator
When one indicator stops improving, use this table to find the likely cause. These are patterns from our experience, not rules.
| Weak Indicator | Likely Cause (Our View) | What to Try |
|---|---|---|
| Reach | List too small or outdated | Rebuild the list; add segments |
| Response | Wrong channel, message, or language | Test local-language outreach, phone, or a different hook |
| Meetings held | Weak reason to meet; no-shows | Sharpen the meeting purpose; confirm the day before |
| Stakeholders | Relying on one champion | Ask who else should be involved; offer a team session |
| Next steps | Meetings end vaguely | Propose a specific next step before the meeting ends |
| Stage conversion | Offer, proof, or price mismatch | Review objections; add local proof; test a pilot |
Relatable Example
If response is healthy but meetings held are low, your outreach is probably interesting but your reason to meet is not. Fixing the subject line will not help.
Mini Case: Reading a Dashboard Before Revenue (Illustrative)
This is an illustrative scenario, not a client story.
A software company launches outreach in two markets at the same time.
After the First Few Weeks
- Market A: steady replies, several meetings held, mostly one contact per account.
- Market B: fewer replies, but each meeting brings in two or three stakeholders.
What Leadership Did
- asked Market A to request introductions to finance and operations in every meeting;
- logged Market B’s objections, which pointed to a need for local references;
- kept both markets running, because both showed movement.
What They Learned
Market A looked busier, but Market B was moving deeper inside accounts. Without stakeholder depth on the dashboard, leadership might have cut the wrong market.
Practical Rule (our take)
Compare markets on the indicators that predict deals, not on the ones that look busiest.
Who Should Own the Dashboard
Someone has to own the numbers, or nobody trusts them.
Our Recommendation
- One owner per market updates the indicators weekly, usually the SDR manager or regional lead.
- One owner overall compares markets and runs the monthly review.
- Your CRM is the source (CRM: customer relationship management system, where contacts and deals are tracked). The readiness tool asks whether your CRM can measure Asia activity and attribution; if it cannot, fix that first.2
If you work with an outbound partner, agree on the same indicators and definitions before launch so their reports and yours match. The same applies if you use a fractional SDR team that works on your market part-time.
Common Measurement Mistakes
Mistake 1 — Only Tracking Revenue
You learn too late.
Mistake 2 — Counting Booked Instead of Held Meetings
Only held meetings move deals.
Mistake 3 — Using Someone Else’s Benchmarks
Set your own baseline per market.
Mistake 4 — Ignoring Stakeholder Depth
Single-contact accounts are fragile.
Mistake 5 — Changing the Report Every Month
Inconsistent reports hide trends.
Mistake 6 — Measuring Activity, Not Learning
Track what you learned, not just what you did.
Leading Indicator Maturity Scorecard
Score each area from 1 to 5. This is our own simplified framework, not an industry benchmark. For a broader check, take the free Asia Expansion Readiness Assessment Tool.
| Area | 1 — Weak | 3 — Developing | 5 — Strong |
|---|---|---|---|
| Indicators defined | Revenue only | Some activity metrics | Six indicators per market |
| Baselines | None | Informal | Set from first weeks per market |
| Meetings tracked | Booked only | Held, inconsistently | Held, by segment |
| Stakeholder depth | Not tracked | Sometimes | Per account, weekly |
| Next steps | Not tracked | Informal | Logged after every meeting |
| Stage conversion | Not tracked | Quarterly | Monthly, by market |
| Learning indicators | None | Notes | Objections and messages logged |
| Reporting | Ad hoc | Monthly | Weekly, same format |
Score Interpretation (Our Guidance)
| Total Score | What It Means |
|---|---|
| 34–40 | Strong visibility. Use it to make faster decisions. |
| 27–33 | Good base. Add stakeholder and learning indicators. |
| 20–26 | Mostly activity tracking. Add next steps and stage conversion. |
| Below 20 | Little visibility. Start with the six core indicators. |
Need Help Managing Early Pipeline?
Next Steps With Expand In Asia
- Agree on “on track” with leadership before launch.
- Track six indicators weekly per market.
- Set your own baselines.
- Fix the first weak indicator.
To go deeper:
Ready to Implement These Strategies?
Book a free 30-minute strategy session where we’ll audit your current growth approach and identify your highest-leverage opportunities in Asian markets.
Frequently Asked Questions
1. What are leading indicators for new market sales?
Leading indicators for new market sales are early, measurable signals that show whether a new market is moving toward revenue before deals close. Examples include accounts reached, reply rates, meetings held, stakeholders engaged per account, next steps agreed, and conversion between pipeline stages.
2. What is the difference between leading and lagging indicators?
Lagging indicators, such as revenue and closed deals, show results after they happen. Leading indicators, such as meetings and next steps, show activity and progress that usually come before results. In a new market, lagging indicators arrive late, so leading indicators are how you steer.
3. How do you measure progress in a new market before deals close?
Our recommendation: track a small set of indicators weekly by market: reach, response, meetings held, stakeholders mapped, next steps agreed, and stage conversion. Add learning indicators such as objections logged and messages tested. Compare each market against its own baseline.
4. What should leadership track in the first six months in Asia?
In our view, leadership should track whether each market is producing conversations with the right buyers, deeper engagement inside target accounts, agreed next steps, and clear learnings about messaging and objections. Revenue matters, but judging a new market only on early revenue often stops it too soon.
5. Are there benchmarks for reply rates and meeting rates in Asia?
We do not recommend relying on generic public benchmarks for Asian markets. Rates vary by country, industry, channel, and offer. Set a baseline from your first weeks of outreach in each market, then track improvement against it.
6. How often should we report Asia progress to headquarters?
Our recommendation is a short weekly update with the core indicators per market, and a monthly review that adds learnings, objections, and decisions. Keep the same format every time so trends are easy to see.
7. How can Expand In Asia help track early pipeline?
Expand In Asia is a Singapore-based B2B outbound and market-entry partner. It runs outreach and appointment setting across Asian markets and reports leading indicators by market, including meetings, stakeholders engaged, and buyer feedback, so leadership can see progress before revenue.
Which indicator does your leadership team trust most for a new market? Share it in the comments or pass this guide to whoever owns your Asia report.
About the author: Joel Berou is Asia Expansion & Revenue Growth Advisor at Expand In Asia, a Singapore-based B2B outbound and market-entry partner that helps companies build pipeline across Asian markets. This article draws on the October 2026 masterclass presented by Nicolas Levitte, Founder & CEO of Expand In Asia. Last updated: October 16, 2026.
Sources
-
Gartner, Inc. “Gartner Sales Survey Finds 74% of B2B Buyer Teams Demonstrate ‘Unhealthy Conflict’ During the Decision Process” (press release, 7 May 2025; survey of 632 B2B buyers, August–September 2024). https://www.gartner.com/en/newsroom/press-releases/2025-05-07-gartner-sales-survey-finds-74-percent-of-b2b-buyer-teams-demonstrate-unhealthy-conflict-during-the-decision-process ↩
-
Expand In Asia. Asia Expansion Readiness Assessment Tool (accessed 16 October 2026). https://tools.expandin.asia/ ↩↩↩
-
Expand In Asia. Breaking Into Asia masterclass (October 2026). https://expandin.asia/events-webinars/ ↩