

A practical guide for measuring retention, adoption, customer health, and expansion readiness across Asian markets
Winning customers in Asia is hard enough.
Keeping them is a different challenge.
A B2B company can build a strong sales pipeline in Singapore, Indonesia, Vietnam, the Philippines, Malaysia, Thailand, India, Japan, Korea, or wider APAC, but still lose revenue if customers fail to adopt, renew, expand, or advocate.
That is why customer success KPIs matter.
They show whether your go-to-market motion is creating long-term customer value or only short-term sales activity.
This is especially important in Asia, where customers may vary by:
- country;
- language;
- implementation maturity;
- support expectations;
- buyer hierarchy;
- user adoption behavior;
- local business culture;
- procurement process;
- pricing sensitivity;
- renewal timing.
A customer in Singapore may expect commercial clarity and strong ROI reporting.
A customer in Indonesia may need local-language enablement and trust-building.
A customer in Vietnam may need more practical onboarding guidance.
A customer in the Philippines may value fast support and clear business outcomes.
A customer in Japan or Korea may require more formal stakeholder alignment and careful quality management.
If your customer success dashboard treats every Asian market the same, it may hide risk.
Modern customer success metrics increasingly combine financial retention, adoption, support, engagement, sentiment, and health scoring. Gainsight describes customer health score as a blended measure of product usage, support history, adoption data, and qualitative inputs like CSM feedback.
The point is simple:
Customer success KPIs should tell you where value is being created, where risk is building, and where expansion is realistic.
This guide explains the customer success KPIs every B2B team should track when expanding in Asia and how to use them to improve retention, adoption, and growth.
- TL;DR — Key Takeaways
- Customer success KPIs are part of market expansion. They show whether new-market customers are adopting, renewing, and expanding after the sale.
- Do not only track logo retention. Revenue retention, adoption, usage, time-to-value, customer health, and stakeholder engagement provide a fuller picture.
- Track KPIs by country and segment. Asian markets can behave differently, so one regional average may hide local risk.
- NRR and GRR answer different questions. GRR shows how much base revenue is retained before expansion; NRR includes expansion, upsell, and contraction.
- Customer health scores should be actionable. A red/yellow/green label is not enough unless it triggers clear next steps.
- Time-to-value is critical in new markets. Customers who do not experience value early can become renewal risks later.
- NPS and CSAT should be interpreted carefully across Asia. The number matters, but comments, culture, and follow-up matter more.
- Expansion signals should be measured before upsell conversations. Healthy adoption and stakeholder engagement create better timing.
If you only do one thing: build your customer success dashboard around customer value, not internal activity.
Who This Guide Is For—and Who It Is Not For
This Guide Is For
- B2B companies expanding into Asian markets.
- SaaS, cybersecurity, cloud, fintech, HR tech, healthtech, AI, data, managed services, professional-services, and enterprise solution providers.
- Customer success leaders building regional KPI dashboards.
- CEOs and founders who want to protect revenue after market entry.
- CROs and revenue leaders tracking retention and expansion.
- RevOps teams connecting CRM, customer success, support, and product data.
- Account managers responsible for renewals and customer growth.
- GTM leaders entering Singapore, Indonesia, Vietnam, Malaysia, Thailand, the Philippines, India, Japan, Korea, or wider APAC.
This guide is especially useful if your team is asking:
- Which customer success KPIs should we track in Asia?
- How do we measure customer health by market?
- What is the difference between NRR, GRR, and logo retention?
- How do we track adoption across multiple countries?
- What customer success metrics indicate churn risk?
- How do we measure expansion readiness?
- How should KPIs inform sales, onboarding, and support?
This Guide Is Not For
This guide may be less useful if:
- your business has no recurring revenue or renewal model;
- customers do not require onboarding, adoption, support, or success management;
- your team cannot collect reliable customer data;
- you only want vanity metrics;
- your company does not have post-sale ownership;
- you are not prepared to act on customer risk signals.
Practical fit check: If customer retention matters to your Asian expansion strategy, customer success KPIs are not optional.
Why Customer Success KPIs Matter When Expanding in Asia
Customer success KPIs help you understand what happens after the deal closes.
This matters because Asian market expansion is not only about acquiring customers.
It is about proving that your solution works in a different market.
KPIs Help Answer
- Are customers reaching value?
- Are users adopting?
- Are local teams supported?
- Are champions still engaged?
- Are renewals at risk?
- Are accounts expanding?
- Are customers willing to refer us?
- Are we learning what each market needs?
For broader market-entry planning, see Go-to-Market (GTM) Strategies for Asia, which focuses on launching products and services across Asia from validation through scaling.
Why Regional Averages Can Mislead
A dashboard might show:
Asia customer health: 78%
But that may hide:
- strong adoption in Singapore;
- weak onboarding in Indonesia;
- low usage in Vietnam;
- good satisfaction in the Philippines but weak expansion;
- lower NPS in Japan due to conservative rating behavior;
- renewal risk in one enterprise account that can distort revenue retention.
Practical Rule
Track customer success KPIs at three levels:
- Regional view — overall Asia performance.
- Country view — local differences.
- Segment view — account tier, industry, use case, lifecycle stage, and buyer role.

KPI 1 — Net Revenue Retention
Net Revenue Retention, or NRR, measures how much revenue you keep and grow from existing customers after accounting for expansion, contraction, and churn.
ChurnZero defines NRR as retained contracted revenue plus expansion revenue, minus churn or downgrades over a period.
Why It Matters
NRR shows whether existing customers are becoming more valuable over time.
It answers:
“If we stopped acquiring new customers, would our existing customer base still grow?”
What to Track
| Metric View | Why It Matters |
|---|---|
| NRR by country | Shows where customers are expanding or contracting |
| NRR by segment | Reveals whether enterprise, mid-market, or SMB behaves differently |
| NRR by use case | Shows which use cases lead to expansion |
| NRR by cohort | Tracks performance of customers acquired in the same period |
| NRR by market-entry wave | Helps compare earlier vs. newer country launches |
Asia-Specific Consideration
NRR may be strong in one market because existing customers are expanding, while another market may show early contraction due to weak onboarding or pricing mismatch.
Do not judge the region only by blended NRR.
KPI 2 — Gross Revenue Retention
Gross Revenue Retention, or GRR, measures how much recurring revenue is retained from existing customers before counting expansion, upsell, or cross-sell. Maxio describes GRR as revenue retained from existing customers after churn and downgrades, excluding expansion revenue.
Why It Matters
GRR shows whether your base revenue is stable.
NRR can look healthy because expansion masks churn.
GRR removes that mask.
Example
| Customer Base | Starting ARR | Churn / Downgrade | Expansion | GRR | NRR |
|---|---|---|---|---|---|
| Asia customers | $1,000,000 | -$120,000 | +$180,000 | 88% | 106% |
In this example, NRR looks good.
But GRR shows meaningful leakage.
Practical Rule
Track NRR and GRR together.
NRR shows growth.
GRR shows stability.
KPI 3 — Logo Retention
Logo retention measures how many customers you keep.
It answers:
“Are customers staying with us?”
Formula
| Metric | Simple Formula |
|---|---|
| Logo Retention | Customers retained ÷ Customers at start of period |
| Logo Churn | Customers lost ÷ Customers at start of period |
Why It Matters
Logo retention is especially useful when:
- customers are early-stage;
- contract values vary widely;
- you want to see account count stability;
- you are entering a new market and every reference matters.
Asia-Specific Consideration
Losing a small customer in a new Asian market may not hurt revenue immediately, but it can hurt reputation, referrals, proof, and market learning.
KPI 4 — Time-to-Value
Time-to-value measures how quickly a customer reaches a meaningful first outcome after signing.
Why It Matters
Customers who experience value early are more likely to adopt and renew.
Customers who wait too long may lose momentum.
Examples of First Value Milestones
| Company Type | First Value Milestone |
|---|---|
| Sales outsourcing | First qualified meeting accepted by sales |
| CRM software | First pipeline report used by the team |
| HR tech | First employee workflow completed |
| Cybersecurity SaaS | First risk assessment completed |
| Marketing automation | First campaign launched and measured |
| Data platform | First dashboard used by a stakeholder |
Asia-Specific Consideration
Time-to-value can vary by market due to:
- language needs;
- internal approvals;
- training requirements;
- local workflow differences;
- support expectations;
- regional vs. local ownership.
For related ideas on onboarding and early value, see The Role of Localization in Driving Cross-Border Success, which discusses how localization can reduce onboarding and retention friction.
KPI 5 — Product or Service Adoption
Adoption measures whether the customer is actually using what they bought.
Adoption Metrics
| Metric | What It Shows |
|---|---|
| Active users | Whether teams are logging in or engaging |
| Feature usage | Whether key value-driving capabilities are used |
| Workflow completion | Whether the solution is embedded in daily work |
| Training completion | Whether users are enabled |
| Admin activity | Whether the account is operational |
| Multi-team usage | Whether adoption is spreading |
| Country-level usage | Whether local teams are adopting |
Why It Matters
A customer may renew once with weak adoption.
But weak adoption usually becomes future churn risk.
Asia-Specific Consideration
For regional accounts, adoption should be tracked by local team.
A Singapore HQ may buy the product, but the Philippines, Indonesia, Vietnam, Malaysia, or Thailand team may be the actual user base.
KPI 6 — Customer Health Score
Customer health score combines multiple signals into one view of account risk or opportunity.
Gainsight describes customer health score as a composite measure that can combine usage frequency, support tickets, survey responses, sentiment, and other signals.
Customer Health Inputs
| Signal | What It Shows |
|---|---|
| Product usage | Adoption |
| Support tickets | Friction |
| NPS / CSAT | Sentiment |
| CSM notes | Relationship context |
| Stakeholder engagement | Sponsorship |
| Renewal date | Commercial risk |
| Payment status | Commercial health |
| Expansion interest | Growth opportunity |
Asia-Specific Consideration
Do not use the same weighting everywhere without testing.
For example:
- support tickets may signal frustration in one market;
- they may signal healthy engagement in another;
- low NPS may be normal in a conservative rating culture;
- low stakeholder engagement may be a bigger risk in enterprise accounts.
KPI 7 — Support Response and Resolution Metrics
Support experience can strongly affect customer trust.
Metrics to Track
| Metric | Why It Matters |
|---|---|
| First response time | Shows support accessibility |
| Time to resolution | Shows operational reliability |
| Reopened tickets | Shows unresolved problems |
| Escalation rate | Shows complexity or dissatisfaction |
| Ticket volume by account | Shows friction |
| Ticket type | Shows product, training, or workflow issues |
| Support CSAT | Shows satisfaction with service experience |
Asia-Specific Consideration
Support expectations can vary by country, account size, and customer type.
Track:
- local business hours;
- language needs;
- channel preference;
- response expectations;
- escalation ownership.
KPI 8 — NPS, CSAT, and Customer Sentiment
NPS measures likelihood to recommend, while CSAT usually measures satisfaction with a specific interaction or experience. Qualtrics describes NPS as a common customer experience metric that measures customer loyalty through likelihood to recommend.
Why Sentiment Metrics Matter
They reveal:
- satisfaction;
- loyalty;
- frustration;
- relationship risk;
- advocacy potential;
- product or service gaps.
NPS vs. CSAT
| Metric | Best Used For |
|---|---|
| NPS | Relationship loyalty and advocacy potential |
| CSAT | Satisfaction after support, onboarding, or key interactions |
| CES | Effort required to complete a task or resolve an issue |
| Open comments | Explanation behind the number |
Asia-Specific Consideration
Interpret sentiment carefully across markets.
Some customers may avoid extreme scores, while others may give high ratings more freely. Always review comments, account context, usage, and follow-up history before making conclusions.
KPI 9 — Stakeholder Engagement
In B2B, one happy champion is not enough.
You need to know who is involved.
Stakeholders to Track
| Stakeholder | Why They Matter |
|---|---|
| Executive sponsor | Strategic support |
| Champion | Day-to-day advocacy |
| Admin | Operational continuity |
| End users | Adoption |
| IT / security | Access and integration |
| Finance | ROI and renewal |
| Procurement | Contract process |
| Regional leader | Multi-country rollout |
| Local manager | Country-level adoption |
Engagement Signals
Track:
- meeting attendance;
- email responsiveness;
- business review participation;
- product usage;
- feedback submissions;
- internal referrals;
- stakeholder turnover.
For sales-cycle and stakeholder alignment ideas, see How to Shorten Your B2B Sales Cycle in Singapore and SEA.
KPI 10 — Renewal Readiness
Renewal readiness measures whether the customer has enough value, adoption, support, and stakeholder alignment to renew confidently.
Renewal Readiness Inputs
- product usage;
- value achieved;
- stakeholder coverage;
- support experience;
- unresolved risks;
- procurement timeline;
- budget status;
- champion strength;
- executive sponsor engagement;
- customer health score.
Practical Rule
Renewal readiness should be reviewed long before the renewal date.
Suggested cadence:
| Time Before Renewal | Action |
|---|---|
| 180 days | Review health and stakeholder coverage |
| 120 days | Confirm value story and adoption gaps |
| 90 days | Identify commercial risks |
| 60 days | Begin renewal path |
| 30 days | Finalize decision process |
KPI 11 — Expansion Signals
Expansion should be based on customer readiness, not only revenue targets.
Gainsight notes that health scores can help time expansion conversations by surfacing behavioral signals such as license utilization, feature adoption, and consistent engagement.
Expansion Signals
| Signal | Meaning |
|---|---|
| High usage | Customer is adopting |
| More teams ask for access | Expansion demand exists |
| New use cases appear | Product value is spreading |
| Executive sponsor asks for reporting | Strategic interest is growing |
| Support questions become advanced | Customer is maturing |
| Local teams request training | Multi-country rollout opportunity |
| Customer asks about another market | Regional expansion possibility |
Asia-Specific Consideration
Expansion may happen market by market.
A customer may start in Singapore, then expand into Malaysia, Indonesia, Vietnam, Thailand, or the Philippines if the first rollout works.
KPI 12 — Customer Advocacy and Referrals
Customer advocacy is a powerful success signal.
It shows that a customer is not only satisfied, but willing to associate their reputation with your company.
Advocacy Metrics
| Metric | What It Shows |
|---|---|
| Referral readiness | Willingness to introduce |
| Case study participation | Public proof potential |
| Reference calls | Sales enablement value |
| Testimonial willingness | Customer confidence |
| Event participation | Market credibility |
| Advocate participation | Relationship strength |
Why It Matters in Asia
Warm introductions and local proof can reduce trust friction in Asian B2B markets.
For a related advocacy playbook, see From Client to Advocate: How to Build B2B Referral Programs in Asia once published.
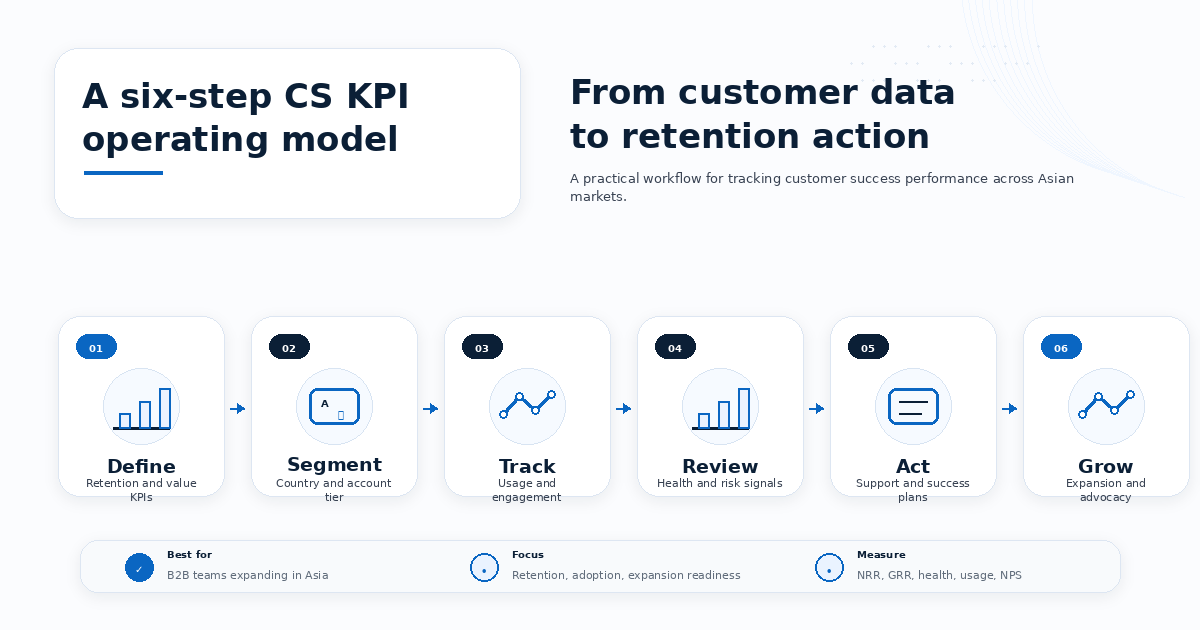
Customer Success KPI Operating Model for Asia
Use this six-step model.
Step 1 — Define
Choose the KPIs that matter for your business model.
At minimum, define:
- NRR;
- GRR;
- logo retention;
- adoption;
- time-to-value;
- customer health;
- support metrics;
- NPS / CSAT;
- renewal readiness;
- expansion signals.
Step 2 — Segment
Segment metrics by:
- country;
- customer tier;
- industry;
- use case;
- lifecycle stage;
- buyer role;
- account owner;
- acquisition channel.
Step 3 — Track
Connect data from:
- CRM;
- customer success platform;
- support system;
- product analytics;
- finance;
- survey tools;
- customer calls.
Step 4 — Review
Create a regular review cadence:
| Cadence | Review Focus |
|---|---|
| Weekly | Red accounts, support escalations, onboarding risk |
| Monthly | Adoption, health trends, stakeholder engagement |
| Quarterly | Retention, expansion, renewal readiness, market insights |
Step 5 — Act
Each risk signal should trigger an action.
Examples:
- low usage → adoption campaign;
- poor support CSAT → escalation review;
- weak stakeholder engagement → executive sponsor mapping;
- delayed onboarding → first-value recovery plan;
- low expansion readiness → value proof before upsell.
Step 6 — Grow
Use customer success insights to improve:
- onboarding;
- localization;
- sales qualification;
- buyer enablement;
- product roadmap;
- renewal process;
- expansion strategy;
- referral program.
Common KPI Mistakes to Avoid
Mistake 1 — Tracking Too Many KPIs
A dashboard with 50 metrics often creates confusion.
Choose the metrics that drive action.
Mistake 2 — Not Segmenting by Market
A regional average can hide country-level issues.
Mistake 3 — Measuring Activity Instead of Value
A completed onboarding call does not mean the customer reached value.
Mistake 4 — Ignoring Local User Adoption
The regional buyer may be happy while local teams struggle.
Mistake 5 — Treating Health Score as a Label
A red/yellow/green status is only useful if it triggers action.
Mistake 6 — Reviewing KPIs Too Late
If renewal is 30 days away, many risks are already hard to fix.
Mistake 7 — Separating Customer Success from GTM
Customer feedback should improve sales messaging, onboarding, localization, and market-entry strategy.
Customer Success KPI Scorecard
Score each area from 1 to 5.
| Area | 1 — Weak | 3 — Developing | 5 — Strong |
|---|---|---|---|
| KPI definition | Metrics are unclear | Basic retention and activity KPIs | Clear financial, adoption, health, support, and expansion KPIs |
| Segmentation | Regional average only | Country or tier split | Country, segment, lifecycle, role, and use-case level |
| Revenue retention | Logo retention only | NRR or GRR tracked | NRR, GRR, logo retention, contraction, and expansion tracked |
| Time-to-value | Not measured | Basic onboarding completion | First-value milestone and timeline tracked by market |
| Adoption tracking | No usage visibility | Basic activity tracking | Role, team, feature, and country-level adoption tracked |
| Customer health | Manual opinion | Basic red/yellow/green | Composite health score with weighted signals and owner actions |
| Support metrics | Ticket count only | Response and resolution tracked | Support friction, escalation, SLA, and sentiment tracked by market |
| Sentiment tracking | No NPS / CSAT | Basic survey collection | NPS / CSAT with comments, segmentation, and follow-up process |
| Renewal readiness | Reviewed late | Basic renewal forecast | Health, value proof, stakeholder map, and procurement timeline tracked early |
| Expansion signals | Upsell pushed manually | Some opportunities tracked | Expansion readiness based on usage, value, stakeholder demand, and market fit |
Score Interpretation
| Total Score | Recommendation |
|---|---|
| 42–50 | Strong customer success KPI system; optimize by market and account segment |
| 34–41 | Good foundation; improve segmentation, health scoring, or renewal readiness |
| 25–33 | KPIs exist, but they may not drive consistent retention action |
| Below 25 | Rebuild customer success measurement before scaling customer acquisition |
Need Help Building Customer-Ready Growth Systems Across Asia?
Expand In Asia helps B2B companies build growth systems across Asian markets through:
- ICP and account research;
- localized buyer messaging;
- sales prospecting;
- appointment setting;
- market validation;
- pipeline reporting;
- market feedback loops.
Talk to Expand In Asia about building healthier customer and pipeline systems across Asia →
Next Steps With Expand In Asia
Customer success KPIs are not just post-sale numbers.
They are market-expansion signals.
They help you understand whether your Asian GTM strategy is creating customers who adopt, renew, expand, and advocate.
The strongest B2B teams track customer success KPIs by country, segment, lifecycle stage, and stakeholder role.
They do not wait until renewal to discover risk.
They use customer data to improve onboarding, localization, support, sales qualification, and expansion strategy.
For broader market-entry planning, read Go-to-Market (GTM) Strategies for Asia.
For pipeline development before customer success data exists, read Building a B2B Sales Pipeline from Zero in a New Asian Market.
For stakeholder alignment and buyer enablement, read How to Shorten Your B2B Sales Cycle in Singapore and SEA.
Schedule a consultation with Expand In Asia →
Ready to Implement These Strategies?
Book a free 30-minute strategy session where we’ll audit your current growth approach and identify your highest-leverage opportunities in Asian markets.
Frequently Asked Questions
1. What are customer success KPIs?
Customer success KPIs are metrics that show whether customers are adopting, receiving value, staying engaged, renewing, expanding, and becoming advocates.
2. Which customer success KPIs matter most for B2B teams expanding in Asia?
The most useful KPIs include NRR, GRR, logo retention, time-to-value, adoption, customer health score, support metrics, NPS, CSAT, stakeholder engagement, renewal readiness, and expansion signals.
3. What is the difference between NRR and GRR?
NRR includes expansion, upsell, downgrade, and churn. GRR measures how much base revenue is retained before expansion. Tracking both helps teams see growth and leakage separately.
4. Why should KPIs be tracked by country?
Asian markets differ in adoption behavior, language needs, support expectations, buyer hierarchy, and customer maturity. Country-level tracking helps reveal market-specific risks and opportunities.
5. What is time-to-value?
Time-to-value measures how quickly a customer reaches a meaningful first outcome after signing. It is especially important in new markets because early value builds confidence and reduces churn risk.
6. What is a customer health score?
A customer health score is a composite metric that combines signals such as usage, support history, customer sentiment, engagement, and CSM input to indicate risk or opportunity.
7. How often should customer success KPIs be reviewed?
High-risk accounts should be reviewed weekly. Adoption, health, and support trends should be reviewed monthly. Retention, expansion, and market-level insights should be reviewed quarterly.